Visionary or Pattern Recognizer?
Believe it or not, what we are about to witness in the Insurance industry has happened before. In that same email to my brother-in-law, I noted that it:
“[h]appened to Blockbuster (Netflix). [It has happened] to Kodak (digital cameras – which ironically enough they invented). [It has happened] to Walkmans / Discmans / iPods / iTunes (Discmans / iPods / iTunes / Spotify). [It has happened] to Tom Tom / Garmin (Phone GPS). [It has happened] to BlackBerry (iPhone).“
Anatomy of a Disruption
And it’s been happening since at least the 1980’s when Clayton Christensen researched and wrote the book The Innovator’s Dilemma. In it, Mr. Christensen examined the constant upheaval in the hard drive industry. One cycle, a company would be on top. But when the next technology was introduced, they wouldn’t be able to respond fast enough to the change to maintain their market position.
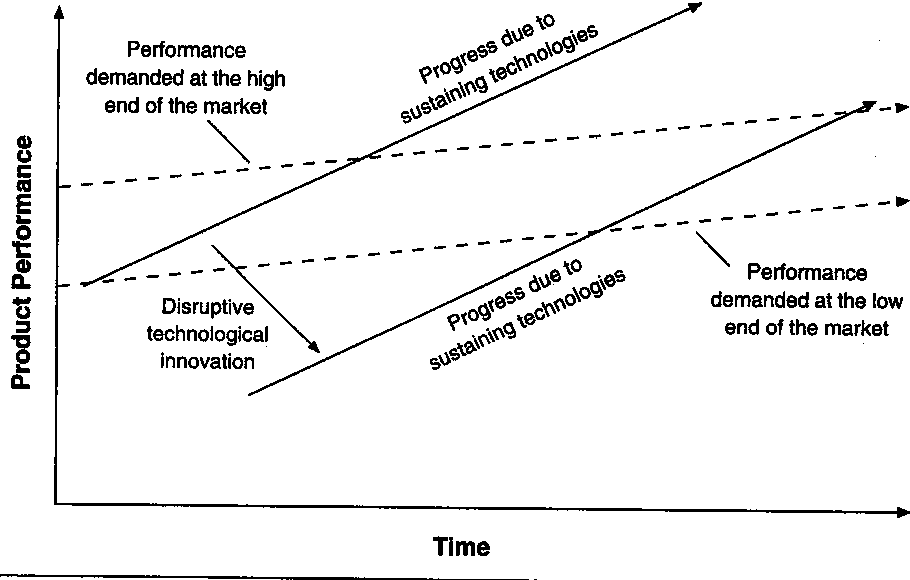
To help illustrate his findings, he created this chart below. The dashed-lines are the product performance requirements for the industry. The solid horizontal arrows show the capabilities of industry performers. You’ll notice that in the beginning, performers can only fulfill the lowest capability demands as denoted on the vertical axis. However, over time, shown below on the horizontal axis, they quickly catch up. This is shown by the fact that the solid horizontal line has a steeper slope than the dashed horizontal line.
But after awhile a funny thing happens. Product performance surpasses industry demands, meaning the product continues to get better; however, industry isn’t able to take advantage of it. That’s what opens up the opportunity for new innovations.
Because while the industry is focused on improving their product capabilities, other companies are looking to extend the market. At first, they can’t even meet the lowest performance requirements as noted by the bottom solid line labeled “Disrupted technological innovation.” But, they offer something “else.” Normally, its more flexibility or smaller design, but it doesn’t have to be.
And overtime, they too continue to refine their products. Eventually meeting the lowest performance benchmarks. And gradually moving forward until they can support the entire industries performance requirements.
Notice that they never get to the performance levels of the original industry player. However, they can meet all of the industry’s performance needs while also providing something “else.”
And there are two intersections here that are important to note. The first is where the bottom solid line meets the bottom dashed line. And the second is where the bottom solid line meets the top dashed line. That first intersection is where you start losing business. And that second intersection is where you are out of business.
But the question is, how does this all relate to Lemonade and the insurance industry? Let’s examine that on the next page.