COVID-19, aka the Coronavirus, first invaded our state in February 2020. In March, Governor Larry Hogan issued a State of Emergency, and things have been flipped on their head since. We’ve talked previously about how change comes for all industries, but few of us ever considered disruption would hit all industries at once the way this pandemic has.
Still, throughout this challenge, we have seen some positive signs. Distilleries are pivoting to provide vital hand sanitizers to the medical community. Marylanders are continuing to volunteer and help out their neighbors and those less fortunate. And even the government has come to the rescue to keep businesses afloat. As recently as late October 2020, Governor Hogan added $250 million more dollars to the “Maryland Strong: Economic Recovery Initiative.”
But the question remains, 8 months after the State of Emergency order that was recently renewed, what is the state of our economy?
Data Data Everywhere
Determining how well the economy is recovering is a tricky task for a couple of reasons. One, there is no one metric that economists agree on that determines how well the economy is doing. And two, there is TONS of data out there that can be used to prove, or disprove, any point you care to make.
Still, in this article, we are going to make an argument that the economy has rebounded quite well. And to do this, we are going to use data extracted from Maryland’s Open Data Portal.
The goal of Maryland’s Open Data Portal is best summed up by this quote from the Council on Open Data:
Maryland’s Open Data Program provides transparency so that businesses, residents, visitors, and civil servants can use state data to aid in decision making. The transparency of data helps improve accountability, as data owners share the responsibility for ensuring that data is accurate, up-to-date and available to the public. Each January, the Council on Open Data makes it’s Annual Open Data Report available to the public.
– Council on Open Data
However, there are challenges with using this portal. Specifically, before we use any data, we first need to determine:
- Is it relevant?
- Is it timely?
- And is it in a state that we can use it? Or do we need to massage it some before it becomes useable?
These are all common challenges Data Scientists overcome on a daily basis. What makes this a challenge here are two things:
- There are over 1,500 datasets in Maryland’s Open Data Portal. While that is great as it provides lots of opportunities, it can also give you the sense that you are drowning in data.
- Also, there is no standard set of rules for government agencies that publish the data. While they are all mandated to do so, they each do it in a way that makes sense for them. Therefore, data is released in different formats in different timeframes.
But, what if there was a source of information where all of this has already been done for us?
Leveraging the Maryland Insights Data Portal
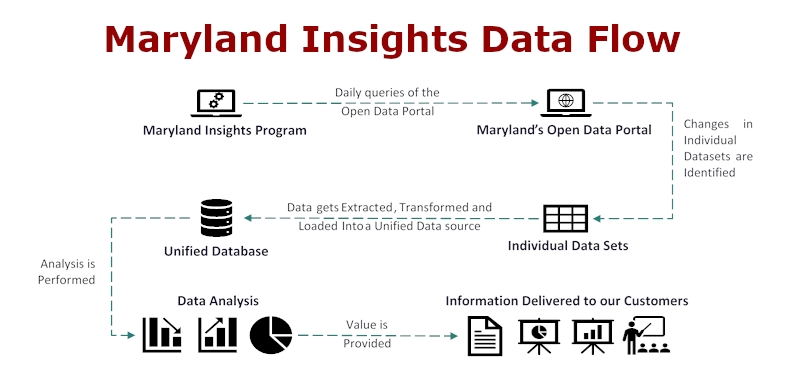
For this post, we will be leveraging our Maryland Insights portal because it has already handled the questions we identified above. We have only included relevant datasets. We know its timely because our program checks daily to see if there are any updates to the relevant datasets and automatically updates them. And our program also handles any cleansing activities necessary to make the data useful.
A quick breakdown of how our portal works can be found in the image below.

Sadly, some of the datasets we would like to examine, such as the Choose Maryland: Compare Counties Demographic or Maryland Counties Socioeconomic Characteristics, have not been updated since the pandemic struck. So while their data is still “technically” timely, it really isn’t for this exercise.
But what we can do is look at tangential data and see what evidence we find of an economic recovery (or lack thereof). For this exercise, we are going to look at data regarding the number of businesses in the state in good standing and shipments into and out of the Port of Baltimore.
Businesses in Good Standing
The Number of Businesses in Good Standing with the State dataset provides a breakdown of the total number of businesses registered within the State of Maryland. Typically what we see during recessions is this number actually goes up. And that may be a bit paradoxical, but the rationale makes sense.
During recessions, people get laid off. People that get laid off, still need to make money. So they start up a business to make ends meet until they find that next corporate gig.
It doesn’t mean that many of these businesses will survive. And it doesn’t even mean that any of these new businesses will make any money. It just means that new LLCs have been registered with the state. And if we look at the data, that’s exactly what we see.

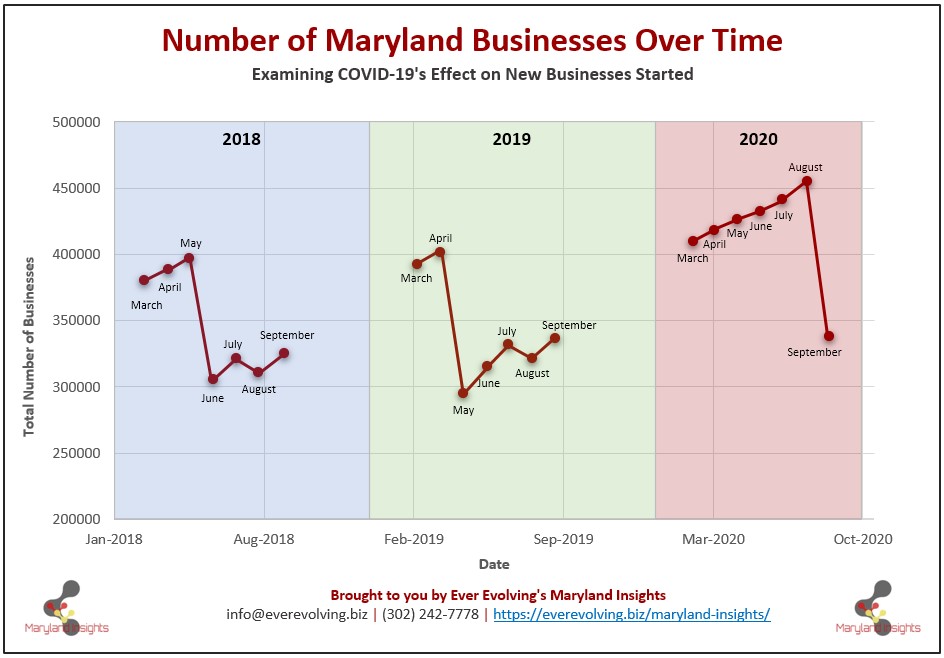
The graph above examines the total number of businesses in good standing with the state between the months of March and September from 2018, 2019, and 2020. In 2018, there was a steep drop off in businesses in good standing between May and June. In 2019, that same drop off happened just one month earlier. But in 2020, that drop off didn’t happen until August.
In fact, we saw the number of businesses continue to climb through the summer months. Which is odd, because Maryland typically sees around 50,000 fewer businesses during the summer months. Call it, the Summer Business Siesta if you will. But for whatever reason, summer business totals are typically lower.
However, regarding the economy, this is a good thing. Because, even though it happened later, we did see the drop-off we were expecting. And the number of businesses in September 2020 is roughly the same as it was in September 2018 and 2019. Which to us, is a sign that things are getting back to normal. And it corresponds with the movement we are seeing in the Labor Market as well.
Shipments at the Port of Baltimore
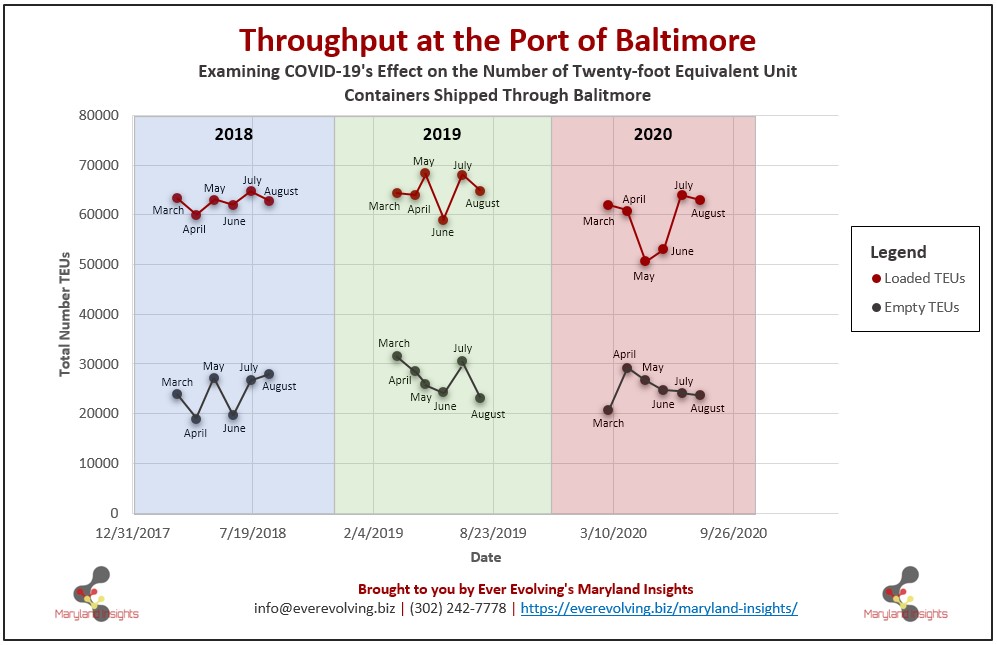
The Maryland Department of Administration Port Administration General Cargo dataset provides numbers regarding the shipments that came into and out of the Port of Baltimore. While it does not get into the cargo that is loaded and offloaded, it does provide information regarding loaded and unloaded containers, which they call Twenty-foot Equivalent Units (TEUs).
As the image below shows, the loaded TEUs in May and June were way below the normal rates. However, they seem to have stabilized and returned to normal levels by July and August.

While we are unsure what to make of the Empty TEUs, it’s encouraging to see that the loaded cargo returned to normal as quickly as it did. Part of the reason they were able to is because of government stimulus programs like the Paycheck Protection Program and Maryland’s COVID-19 Emergency Relief Fund. These programs got money into the hands of business owners and their employees beginning in March and April 2020, and the trickle-down effect was consumer spending picked up a few months later.
Better, Together
While neither of these datasets point to a definitive economic recovery, taken together they do provide encouraging signs. No doubt the increasing cases of COVID-19, in Maryland, the U.S., and the World, is a troubling sign. However, ahead of those outbreaks we are seeing signs of the labor force ramping back up. And we are seeing signs of consumer spending returning to (closer to) normal levels. Both of which are very welcome, and positive, signs.
That type of insight is not something provided to you by Maryland’s Open Data Portal. Sure, the data is freely available, in the sense that there are no licensing costs associated with it. However, it is presented as individual, siloed datasets and therefore labor-intensive to get it to a state that it is useful.
Yet sadly, the world is not a siloed place. Trends in the workforce drive trends in purchasing. Which drive trends in shipping. Data gets much more fun, and much more expressive when it’s allowed to play together. Which is exactly what Maryland Insights is designed to do!
And as our tool updates itself automatically overnight, when there is data relating to the effect the rising cases are having on our economy. We will have that as well.
Maryland Insights
Maryland Insights provides Maryland Business leaders with the information that they need to grow their brand. By accessing publicly available datasets from local, state, and federal government sources, we provide Maryland-based businesses with the demographic, economic, and socioeconomic information they need to make sound business judgments. We do this by handling the “grunt work” of the information harvesting by combining data elements from a broad variety of disparate datasets, and handling any scaling, cleansing, synchronizing, and hosting activities required. We then provide this information to our clients through a variety of statistical and graphical breakdowns accessible via a secure portal. Access to the portal is paid for via a monthly per-seat subscription.
Check out our State of the State Report from Q1 2020 to learn about what datasets our portal contains and to get an idea of the information that can be extracted from it. And sign up for our newsletter to have this and other great content delivered directly to your inbox.